Diagnose
Get to know the 20|20's Diagnose setup menu.
Updated January 28, 2022
The Diagnose menu lets you quickly see if anything is wrong with your setup and requires troubleshooting. If all is well, everything on the Diagnose homepage will be green. If not, the menu will help you drill down and isolate the problem so that you can fix it.
You should visit this menu whenever you start up your 20|20 or change any configurations in the Equipment or Systems setup menus, just to make sure everything is green and functioning as expected.
Table of Contents
Find the Diagnose Menu
The Diagnose Menu is easy to find. Simply go to your home screen, if you’re not already there, and press Setup at the bottom of the sidebar, followed by Diagnose.
You can also add a Diagnose control widget to your home screen to get to the menu with one click.
Understand Diagnose Color Coding
The Diagnose menu is designed around a simple color-coding scheme to help direct your attention where it’s needed:
- Green is good. Everything is working and communicating as expected, and no action is required.
- White means an unexpected device has been detected. You should make sure that all installed devices are configured in the Equipment and Systems setup menus.
- Red means failure. The 20|20 is unable to establish communication with an expected device, either because it is missing or has failed.
- Yellow means substandard performance. A device is not functioning at normal levels, often due to low voltage or high CAN bus errors.
- Black means disabled. You have disabled that row in the Active Rows setting in the Equipment setup menu (if the rows are black on the Diagnose homepage) or in the Active Rows setting for a particular system in the Systems setup menu (if the rows are only black within specific sub-pages of the Diagnose menu, like Seeding or Nitrogen).
- Gray means not ready. The 20|20 is still establishing communication or waiting for firmware updates to be installed.
This color scheme is repeated throughout the 20|20 to help you recognize problems quickly even if you’re not specifically looking at the Diagnose menu. Here are a few places you can look at for a quick diagnostic status check:
- A Diagnose control widget can be added on the home screen (and comes by default on the Metrics layout). It changes color depending on the overall status of the implement.
- The Setup menu homepage includes a chart whose top row gives you a quick overview of the status of each row on your implement.
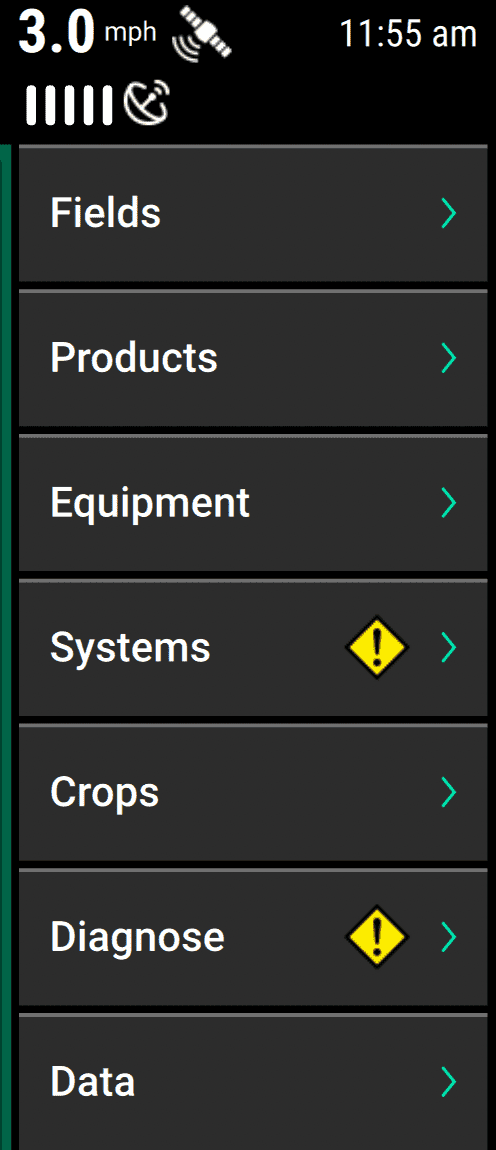
- Inside the Setup menu, an exclamation-point icon next to the Diagnose button in the sidebar indicates that something needs your attention there. (An exclamation point next to Systems indicates that some configuration in that menu is incomplete).
Navigate the Diagnose Menu
There are five basic things you might go to the Diagnose menu to do:
- Drill down to locate and troubleshoot a particular problem area
- Perform a health check
- View the Event Log to see previously dismissed notifications
- Turn on and use features that a product support specialist may ask for when providing you assistance
Let’s look at each one in more detail.
Locate and Troubleshoot Problem Areas
When you arrive at the Diagnose menu, the first thing you want to do is look for any systems or rows that are not green:
- A row chart running along the top of the page shows you the overall status of each row.
- A diagram in the center of the page visualizes all the systems on the implement.
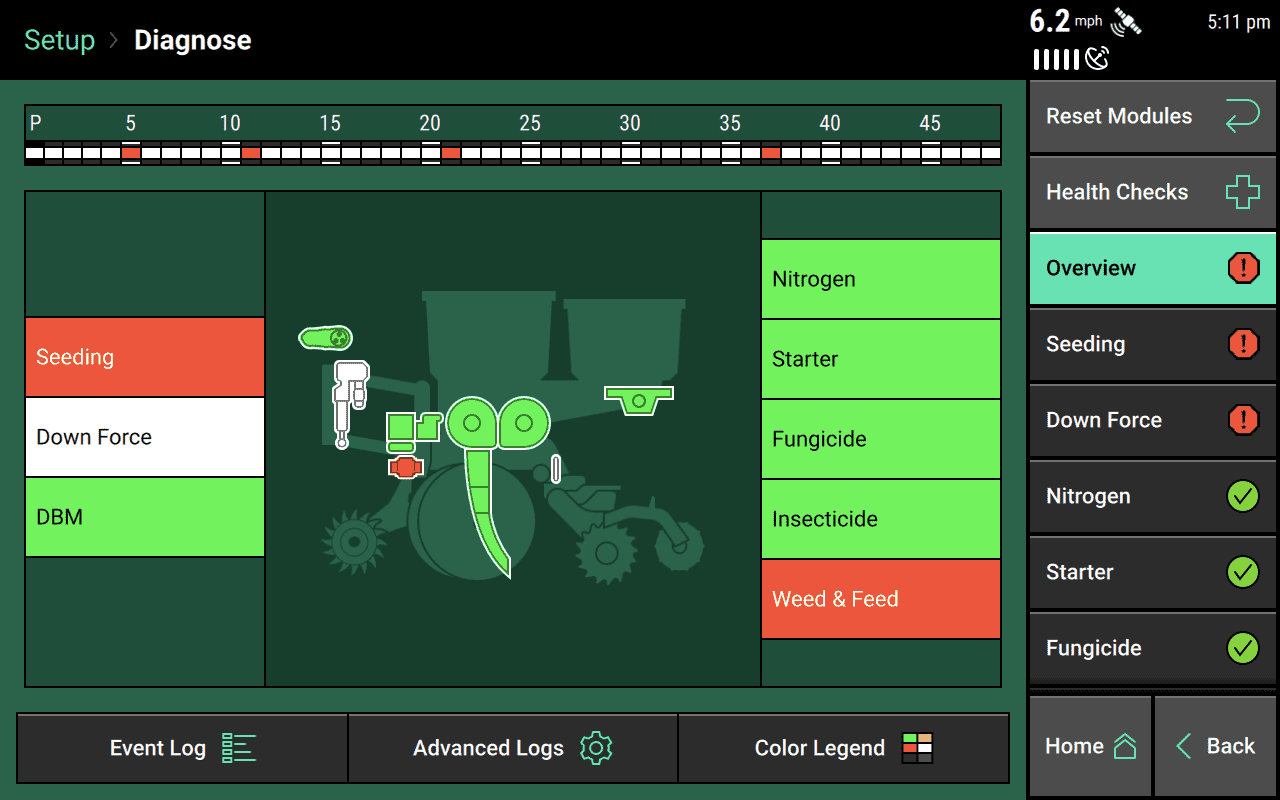
If one of the systems is not green, tap on it to see the system status broken down in terms of specific pieces of hardware.
Once you know which hardware is causing the problem, you can tap one more time to see a detailed row-by-row chart, including voltage and other information that will help you troubleshoot and get the system back to green.
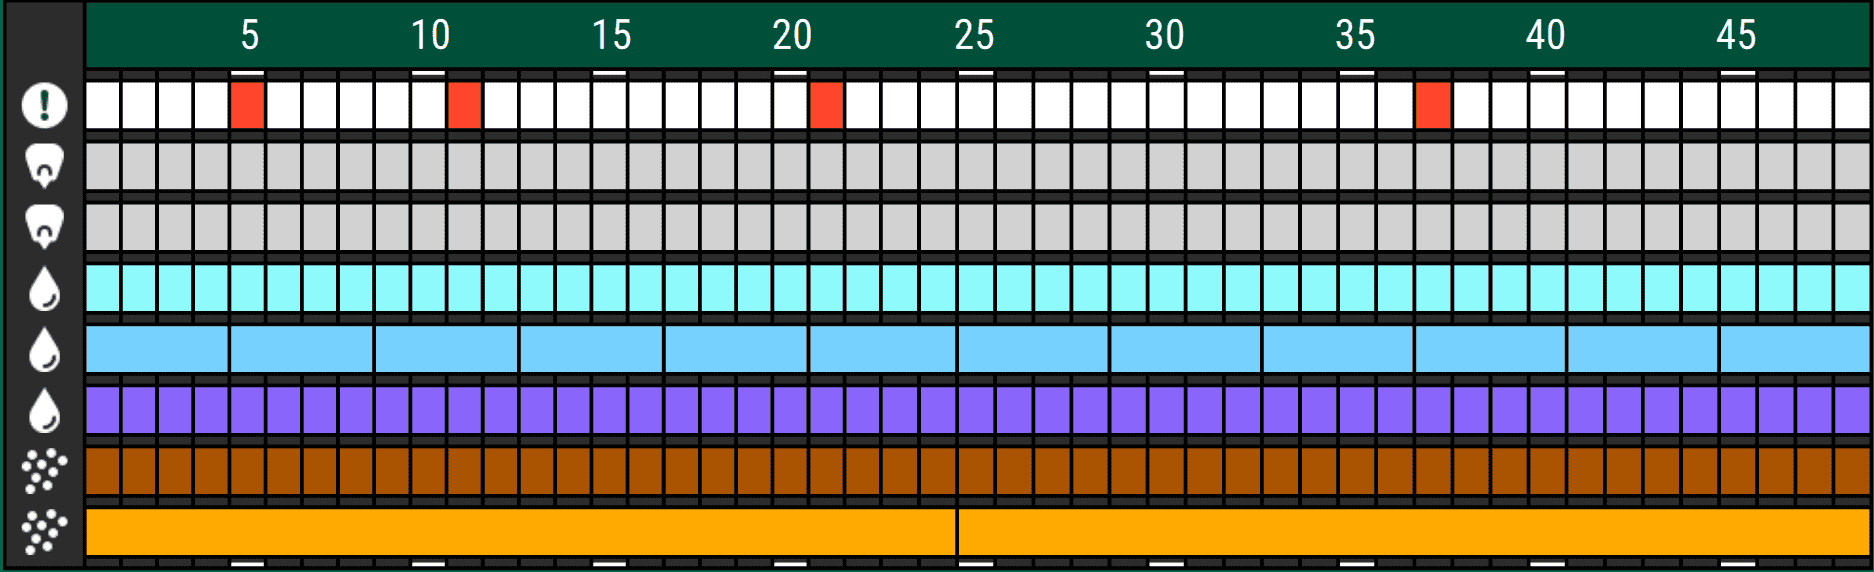
Alternatively, instead of drilling down into particular systems to diagnose your problems, you can explore the planter on a row-by-row basis by visiting the System Schematic. On the Diagnose homepage, scroll to the bottom of the sidebar and tap System Schematic. This will take you to an interactive tree like the one pictured below.
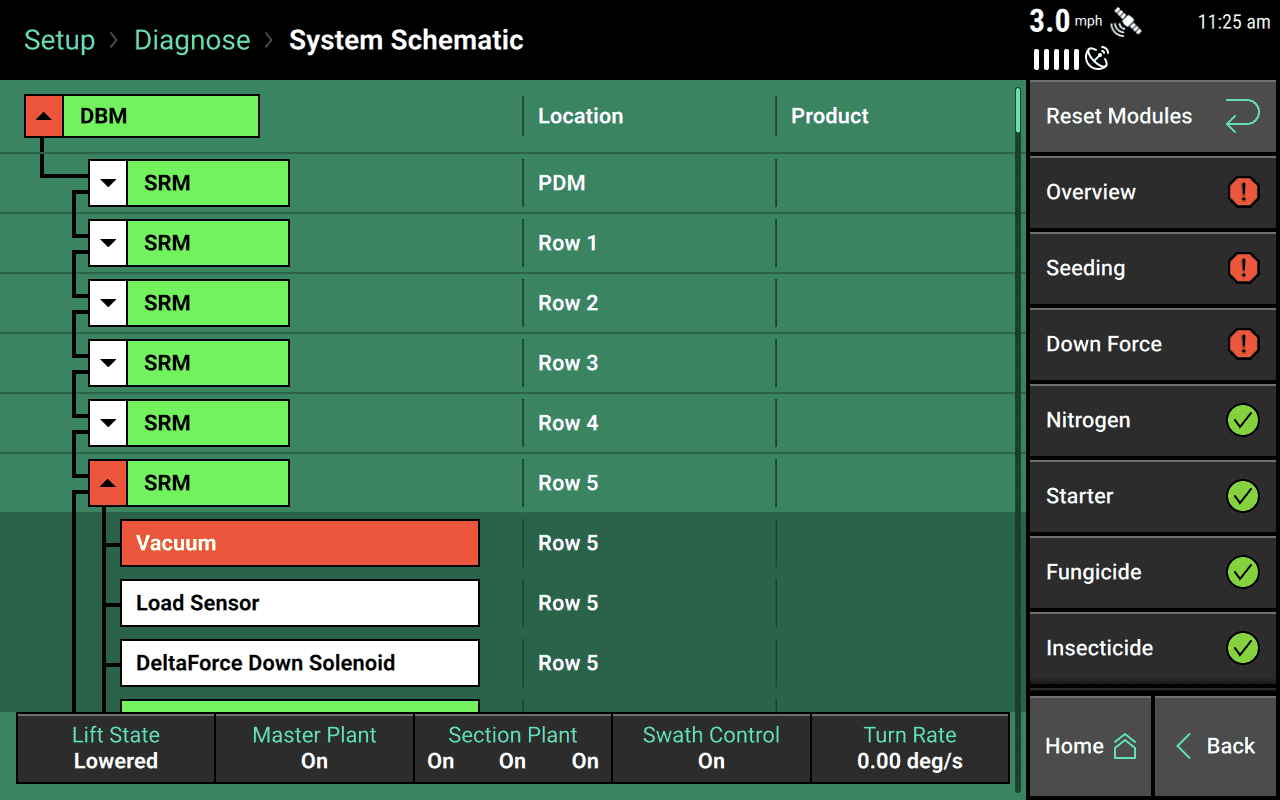
Each row is color-coded as usual, and you can toggle it to view the status of each piece of hardware installed on that row.
If you believe that everything is configured and wired correctly but the 20|20 is still showing a piece of hardware as missing, you can force it to try to reestablish communication with all modules. Simply tap Reset Modules at the top of the sidebar.
Perform a Health Check
Health checks are available for many systems. They allow you to run systems and view their diagnose tables in the shop, without having to go out and actually apply product on a field.
To see what health checks are available for your systems, just go to the Diagnose menu and press Health Checks in the sidebar. All available health checks will be listed, organized by system. Tap on any of them to begin one or to learn more details.
View the Event Log
New notifications are always visible from the home screen, where a bell icon at the top of the page opens up the notifications center. But sometimes you may dismiss a notification from there only to decide later that you want to see it again. When that happens, you can go to the Event Log, which keeps a permanent record of all notifications you have received.
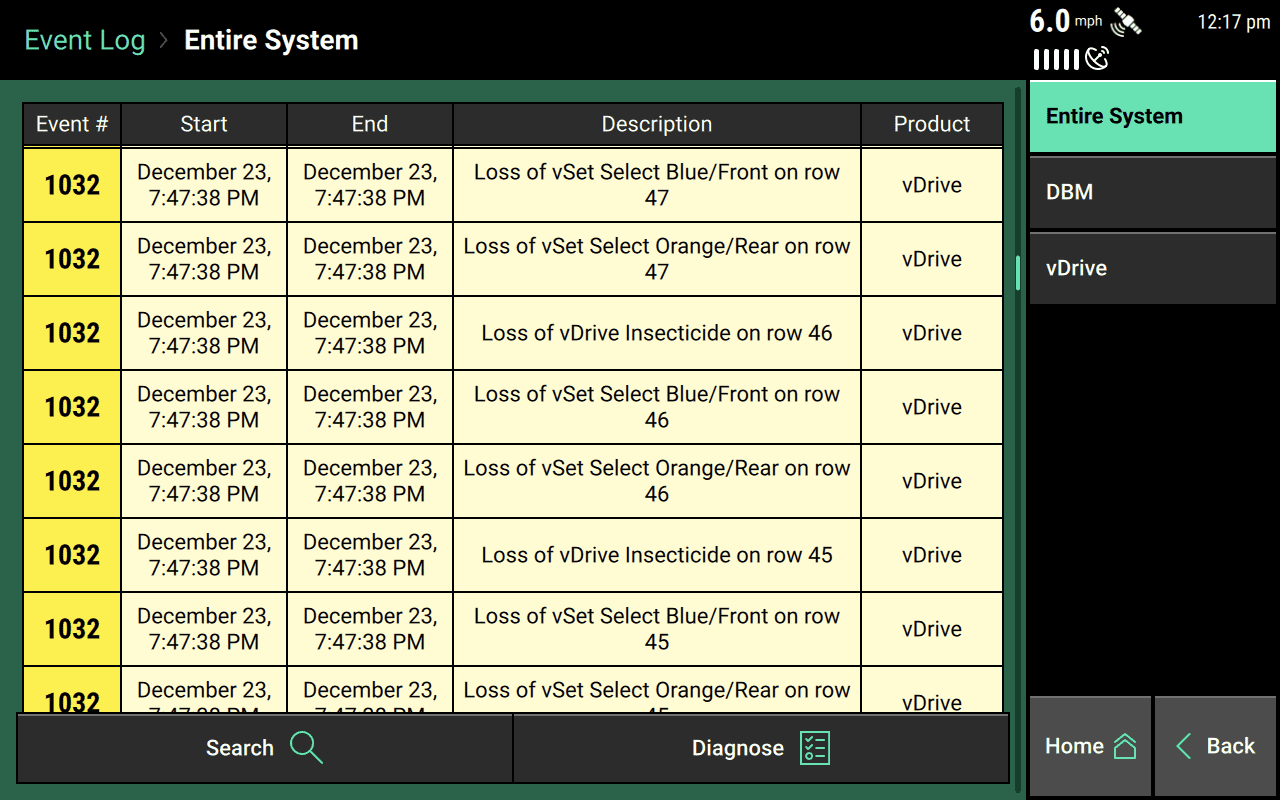
To view the Event Log, tap on the button at the bottom of the Diagnose home page. This will take you to a chart listing all notifications in reverse chronological order.
The event log is also accessible from the home screen. Simply tap on the notification center at the top of the page, then press Event Log at the bottom of the pop up.
If you want to find an old notification that is buried somewhere, you can use the Search feature at the bottom of the page, or you can filter events using the options in the sidebar.
Access Diagnose Features Needed by Product Support
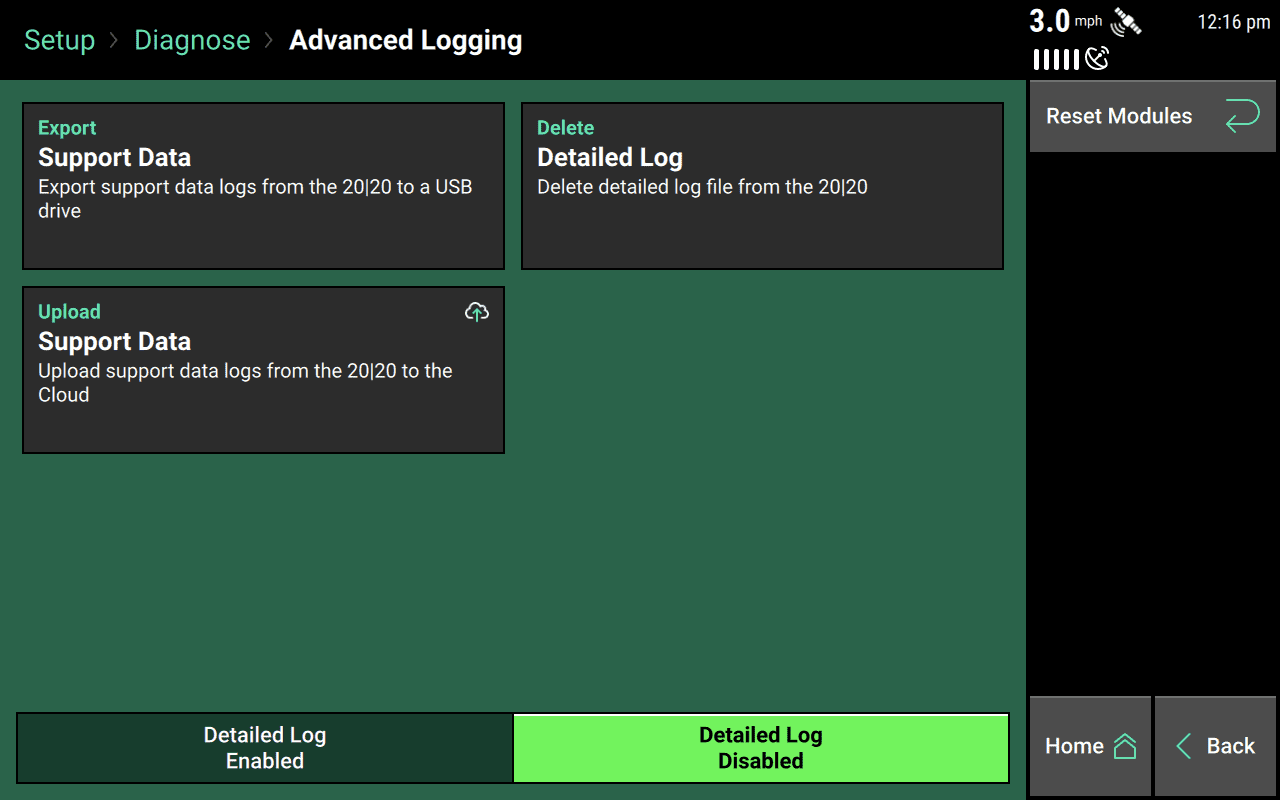
If you are working with product support and they request support data or ask you to turn on detailed logging, you should press the Advanced Logs button at the bottom of the Diagnose homepage.
Once there, you’ll also see a toggle button at the bottom of the page to turn on and off the Detailed Log. This feature is only useful if you’re planning to share data with product support. After letting the log run for a minute, you can export the resulting support data to USB or to the cloud using the main buttons on the page (as well as delete it when you no longer need it).