20|20 Software Overview
Learn how the 20|20 thinks and how to harness that power to your advantage.
Updated January 28, 2022
When you are getting used to a new 20|20, it can be a bit overwhelming. At first, you may not know where to turn with all the settings and options. But once you find your bearings, you’ll find the power that comes with that customizability.
This article will give you a high-level overview of the 20|20 software: what it does and why. After reading it, you’ll be able to get more out of the specialized articles that deal with specific settings, because you’ll see the bigger picture that they fit in to.
Table of Contents
Think Like a 20|20
To get the most out of your 20|20, it’s helpful to understand how it “thinks.”
Divide the Implement into Parts
Depending on what it’s trying to do, the 20|20 has different ways of splitting your implement up into parts:
- Rows. The 20|20 was designed with row crops in mind. So naturally the first thing it does is divide your implement into rows. Every row has its own associated data and hardware, and the 20|20 can use them as building blocks to combine into larger units, like the ones below.
-
Swath Sections. When you’re using the 20|20 to control your implement, you often want it to stop applying product when you enter part of the field that you have already covered. Although that sounds simple, it actually raises some tricky questions, like which rows specifically should shut off and when. Swath sections are the 20|20’s answer. Each swath section is a group of rows that the 20|20 can turn off and on as a single unit, based on when the whole section begins to overlap previous coverage.
For the most part, you won’t have to worry about swath sections, because it usually makes sense to treat each row as its own swath section. But it’s good to know that you can combine them. That can be useful, for example, if you want so-called “dual ends” — end rows that don’t switch off on their own but wait until the next row hits previous coverage. By decreasing end-row sensitivity like that, you can sometimes avoid underplanting near obstacles like trees.
- Rate Sections. When controlling the implement, the 20|20 tries to make sure that each row hits the targets you set. But you aren’t limited to setting one target for the whole implement. Instead, the 20|20 lets you group rows into up to four rate sections, each of which you can configure independently. So, for example, you can have one set of targets for your even rows and another for your odd rows, or even single one row out for experimenting.
' width='986' height='116' xlink:href='data:image/png%3bbase64%2ciVBORw0KGgoAAAANSUhEUgAAAEAAAAAICAYAAABJYvnfAAAACXBIWXMAAAsTAAALEwEAmpwYAAAF1ElEQVRIiV2NiVOU5x3H%2bRMMGyG7m6oLLAhyuCe3stwsLFeMmSSNzmicqIm3UydOzDRTtG2AZblhYZd3F%2bMBRGJsM2nNGKu4GOIBLC6rMU1TR2M8ItY6Ho1%2bOu/zVjrtO/PM%2b/s8n%2b/390TEGZLR2gzEVGYTW5mNttDIi0UmdI5s9FW5aItMaAtNxDhkn8OLxWa0BUZ0jizBijeKrugXGEVG9rqKTH5RYkGTr%2bz/7z6lr6/Ond0n7xdcYkEr8jkkvWRjXqkFTYFB%2bIW1ecy3p6OxLSamIovEWhsL7BmCF5RnsrAmjxhHlnhvflk68TVLiXVkCz/PniH68h7Zzyu1inxEUmIS6gIDhlUOzKurUJeY0ZSZMa2uJnf9cjRlFnFnebMG24bXUNstRBcZyFq3nMLNbxBdYkRTasL8Zg2Fm3%2bJutiIusxM9vpXsG14FXW5RdylrrSTtXaZsq/YKPZX7liDptyCpthE2soK7NtXoa3IQFNkxLC6lhV1W0l4aQnRhQZSVthx7FiLflku0QWLSVthp/rddaS8Xkx0gYG45TZe3rWJ9DVVROUvRr8sj%2bXvbyRn7TKi8tOYX7OE2p3ryd/wqujPq8oSPkIfH8/c5BiiTPFEmxJQpeiITNGhsSahtSahSolBlaxDbUlEY01ElRpDZLJOZKPNcl7mOF6wJKOxphCZHIsqVS9Ya01FlRZP5KJY5hoTiTLJfb3IPMurUuN5LkXH82Y90daFqIyxPJccg8qciCYzFZUhgTmyt%2biJsibwvDmOOck6VKaFaDPTiDInMid5ASpTHNrMRURbExQ2JBBlXcRc4XVEGmNRZyShzkhkTsoCIg3xvJCRQkSZ3c6ugT58l87guTCK8/gRXCc/E3NvMEDLyOc4j/8Bz1SA3qkAbaePUn90GG9oVGSaT/6RruObOXhhCwcvbKPz2Ft4Tr0t5v3BLfi%2b3kjrn9YwENrOwaltwsmZgdA29k9uxfv1OoY6Bxnzhgn0jfMX9zhHWncTHP6A8aHdBD76FUea%2bxnzfcOI5xwB7zSHXQ2Mf/w%2b5wfrODvwHp%2b42jktXeJk7xnx/7S5m7ED74r%2b5KFfc7i5nhHPFKe850X/U9c%2bxg7s5Nzgb4god1Sw42Avnstn6J4e5bdfHub3J47QHT6NO3xazHuODc9y4%2bjn1P15SMw9F7/id8c/wXXsLfaF3%2bHAxc24vlhJx8hqPprewL7wRtxfraH%2bs9fFvD%2b8ifaTq2g6%2bobC05voHFvJvpb9jPaEGZWm%2bKL9LIecu5g49B7B4TpO%2bDZyqMFLwHuJQN8EJ9whBuv3cHZgB5PDdYwd2M7gh02M9IY55Z0QuaH6VgJ7twg/PrSTwYY6vuyaZLQvyClPmKEPJQJ7tzL%2b8QdE5CzJZfee3Xi8Hrq6u2lrb6O9owN3jxtXczO%2bfj8%2bv5%2bOzg5a29tx9/SI%2b67uLlwtLfj7%2b/H5fXR2ddDa1kZLawudXZ309PbQ1OzC3%2b9H8vuUvMx7/Ug%2biZ5eN00ul%2bhKPh8ej4dGp1PJ%2byQ8nl6cTU4kv58%2bSUKSJOElySfmPqmPhsYG0Zdn%2be9sasLj9Yq%2b3%2b%2bnsbFRYUkSe10uF93uHvGezM4mJxHlJWVMnjvPvx484h8/zXDr%2bg1mbv3EzM1bfP/X73n23bh6jWt/v8rDe/f54cpV7vx4g79d/m7W377%2bI1e%2bu8KNa9e5d%2bcud2/e5vL0N7P%2b5rUf%2bPbitwo8hft3ZghPhWf9P%2b/MMB0MzfpH9%2b4RmpgSs3x%2bfvCQqfFJ%2bPmp4CcPHxM8NwFPgCfyxVNCE0Ee3X%2bg7HgCU%2bcnefzgsbIDuHQhxMztu7NvhiaCRCzKS2dxcQ5Z1SVkVRdjKsvDbM8js6pIHGtFAdaKfDIrZS7GUm7DVLp0Ni%2b7Zz67pgRT2VIs9jzhZE6XfbmNrCqFZ/NVSl7xSj%2bnppR0%2bb3/YcVn/IczHIUKOwrJqS0l3aHkBdeUip7M8h6Rr1TyMmf/n5ff/zd298gr6R2PsAAAAABJRU5ErkJggg==' /%3e%3c/svg%3e)
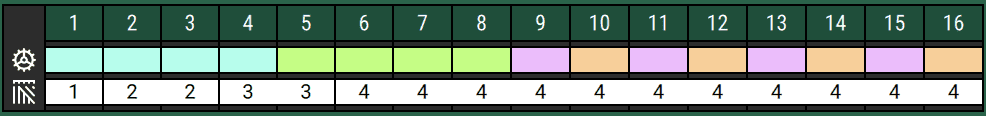
This chart, shown on the Systems menu landing page, illustrates both rate sections (the colors in the top row) and swath sections (the numbers on the bottom). The numbers along the top are individual rows. The example is a little absurd but nicely demonstrates how flexible swath and rate sections are. They can have as many or as few rows as you like (in this example, rows 6-16 will turn off or on as one unit). And rate sections can even alternate from one row to the next. - System Row Assignments. Not every row has the same hardware on it, so sometimes you want one row to be controlled based on sensors on another. To allow for that, the 20|20 thinks in terms of row assignments, groups of rows that are assigned to particular pieces of hardware.
' width='1724' height='284' xlink:href='data:image/png%3bbase64%2ciVBORw0KGgoAAAANSUhEUgAAAEAAAAALCAYAAADP9otxAAAACXBIWXMAAAsTAAALEwEAmpwYAAAGj0lEQVRIiVWQ%2bVfaZxbG%2bTcal4xRW02MNS5gZFERTJVFcasLxJnpiVEBY90bkrhETWNk0wBCUEFEkU2MiPHMTNuTnjOdtPmfnjnv/QKSH%2b553/e5z/089/vllVZXoEBWg0JlPQrbBVQF7XyUdEpwSy1EQVrjdAGKVA2409eCItV9rqe47pf3NKO0U4yCNj6nKzIsMSq%2bl2d92VLU406fDCUdouuZbI4QFX0yysvukOYVd4hohy9ZAuS38VHW3UyVu3eGebtXilKNhHwsu7BdAF55WRkK5LW42SXCzQ4h/qYR4YZSgPuPelD3DxXdmXazU4gCdQO%2b7m1G3/MJVGofIE9Vj5udXC9P3YAWow6tT7TIUwo4XSOiu2CkF9rlH1GkEaKwQ0j%2bwo4GFHVJ0PPMCPFIF75S8NM5IuSr6nFX24bhl9Oo1H6XkyOie90PGmiXp1DcJSIO47HZr5QC9D0zoGPuUXrmOovNDixOosU4iBtKfnZvXtntcuTXVyC/sQr54m%2bp8sSVqNK04I5CjBuiu6QVSKqQJ6pEiVyAut7v6E1%2bSbrE36K6S46yNiFuCO9SnxW731FKUNvTijzyV3HFmI33UN/fjvJ2IeUQk%2bWIK1EkrcX9AQWdLDfLE1VShqCvLWeH66wKVSPuaVqyM/k5zHtdclQoJdw3pXfmlX1TjlJpLUrkdShtFaBEzqeq0khRoRSTfqu5BqWtfJTI6nC7XYjqbhmKpTX0ppLzUSrno6a3lfqsx/xMY8wKtQSVKgmXkfZmZqq7W3BbIUKxrPaaJ6vD160C1HTLUK4QoSTDkvPJx/y1fQ84TjqfnbekNajsaESVppneuVms7nW10DcVy%2brwTXsDSmV88FRTD7BgNcP5SwKbsQBe%2bd2wJk9gfn8My3kItosw7KkwzIkgVgJu7n52BFvyBLaLk%2bxpT0Wwuu/CRthHPqbbLyN4fbSLV0e7xOS8YfJvpSJ4Ew9gye%2biWeplmGmuJRnCmn8Hlvgh1kO7eB3xY/tDFJvxQ6x438KWCn85cxGGNRnCi30HnfZ0VqbY3lb6phO83HXAeXUKnuJJK%2bYsFjh%2bPcdG7BCrezuwJCPY%2bhCH9SJKd3a%2bSRxjOeCB/TIOazIKaypKui2V9qRiWPd78DoSwFLgHSznYdiv4lgPeLEe3MPWVQLWVIRmmd%2bWimEjHsRK0EtMjvEl03YZx6rPjc1YEKuhfbyKHGDr6hTmxDFWvC7y2i9jNMf8Ge7SgQfmc/YzON41N5bNX/Y64PhwBp50QILx2R%2bwaJvHTz9PYcVlgsk8jQnTKJ6b57C0NY9F%2bxyeWWYwvWrA8vYCXtjmsLA%2bhWfmaUy/1Gc9Tzdm8dwyS9qifR7za5NY3FrAivMpJpfGML86iUXbHHnZjGlzGjNrHJPN/fQqzVw15DBnsGhbwNz6BJ5uTsG0MQ3TmxmsOE3UN5oek7bI/DaOy/Jf2GaxtD2Pp8z/ehom8xRm14zX%2b/88gzWHCbxmnRgW3xrCv/vgTWzj9HMARx89MO%2bv4%2bg/u4j96Ufskx/Hv3vhObci/lcAkT/2sZdw4vAXDzxJG/Wjn3zYO3Mi8G83adH/%2beCObiH0cZeYjtgbuCNbNMt6sU8HCP7mwbsLOxKfD3H80Yu9MxdpnnOOybLfnW7j%2bNc97F1tI/ibGweXbvhSLsT/5DItvnV6M2/kD8b1w/3egvB/9xD/6wD%2bDy74Lnbom7wXdpzS/j7shO14/zkIXm1DDYaHu2GcHIbeqMPj0UHoDTqM6YfobTA%2bxMjoAKeNcxqrUf0gxg1ajI4NkofVmGEIY3ot%2bUmbeEhe5ns00g/9BJtlGufPMg1czrhhCOM5GtWEjjjjei3nm2BcrkeZ%2biF6sz7LYTrbKZPB%2bdNZjJH%2bJsb98cnfwWvTSeGxrCJ1%2bg6x4DaOfVachV14H95BMurBacjBaScuxI/eIhl1U4UP7PSOHb0lf%2bLESTOMEQls0T0RctDc6bEDkUOmsftbnEd2cHbipLqIeciTCDmJx/rsft1jXLaPC%2beR9Jne4SzszHrZLCvGzuVnZlkxHs2dOOm7/pXYBa%2bsoRpCpQSNHc1UYlUjJOom9D0egPphJ8TqRtKaOqV0tg0oMKTXQaxqys5I2NkpxcCYFm2DSogYr1NKxe6M0zvST9zGTm4mU4N6HZRaNZeb4amb0NIth844DHnvA4jZXM5%2b7UMq2oHxiZnuse/o%2bmcP%2bkb6yUc75OzYPzYE9bAm22tSN%2bP/LU4xZXDbmWsAAAAASUVORK5CYII=' /%3e%3c/svg%3e)
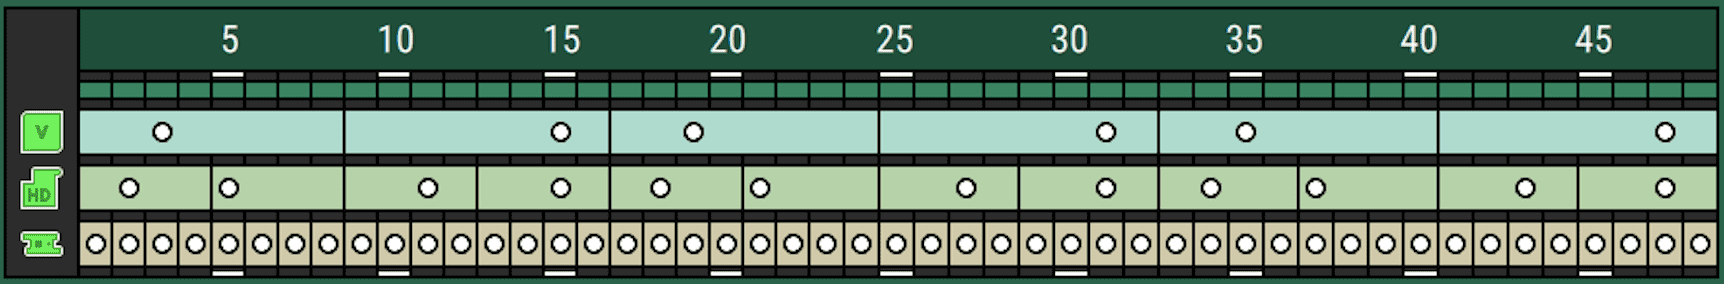
This chart, from a liquid system setup page, shows row assignments for three module types. The bottom module is on every row (notice the circles), but the top one is only on one row out of eight, so the system is divided into groups of eight rows for that module type (notice the lines dividing the groups). - Active Rows. Finally, at the highest level, the 20|20 divides the implement in two — the active part and the inactive part. It does this for each system individually and for the implement as a whole.
' width='1878' height='250' xlink:href='data:image/png%3bbase64%2ciVBORw0KGgoAAAANSUhEUgAAAEAAAAAJCAYAAACCPip6AAAACXBIWXMAAAsTAAALEwEAmpwYAAAEuklEQVRIiW2P6VNTZxTGL9wkdJSCtTqMtqKlhJAdLhCSGyQhZUvCKjsZx%2bpYDSQito4zHdppZQtZWLNghVKKStu/QrAznekHl04/9M95Ou%2b5C4t8OHPe%2bzzP75xzuXOCCQV%2bB/L8teDaasC1y9UmID9QR8Xeqk5VC12HU/YOMzXQBB3QdtSfwNSgoNP1/rw2gRg276Q9BZ1O5J9wmzZYT9x7TJsg3eY/fpsAPlBH3BHGYDLC/egraIe94Hpd4K6J4Prc4Lod%2bPjLAPTRIXBdDkljHpUL4lQY%2bnvDB16fCK6nHudvdcLz/Tjy%2b%2bU803ud0A554Z9/hNK73YcYaU/FRAhNP0QpR3mZ0Q03oS81hZJbHZRTmS4Hqh7eQsPUXbpFvbnHidOhFvSnpnDhdtcxpg72hzfh%2b/GeNJ9x/W5w5aZKFIhm8Fct0Hns0Hrt0DbawDdacTYg4kKPl946j03yWPfYUDrQguJWh%2bR57eRrGq0443ehtO8LKddoI4/pp3wC9KNBFLXUHWHY%2b2JvE0r7mumtYXNk/QOfgPKRAApbaulb2Z1/1UJ3XbrmO4GpxpXB1hOZjwIuXB5oof9gN2k8NnBlV8rAcRzyhXJoLpeA53nwDODyUGTT44ybvTnwDWZoik6DP/shdA0WnC8sgrbOAP7SeWI0XilXXG1AsWhDHsdJRxWeAn%2buGNoGC87qTkHnNIL/5Bz4Ah0dxnYbPiuDWOeAWW%2bA1WCE1VAJa0UlLBWVuOp0wW4y09tWaaSMWV8Bp1BLxXSpmG5AlcksMUaJYfNYZ16trQpuh1PeYaQdnDkooOziFfQ%2bCGNyYxmRlXlE1pOIrsUwlpYquhqTtPQCVWQ9gfDSDCK5BKLZOCJrMUSfHGIyC4iuzksaYzKMSSK8KDOZOGWZT%2bxqDBPpOCZzSUxm5colcT%2bTwL21GO5nE6pO71yS8hPpBZVRMqwfZyYVJhMnj2ZnE/jmyRI4S8gB0V6Pr39axuZ/fyP7%2biVyb/aRe7tPfV1%2bU1drD%2bvvXh1oLPt6T8op2XevVE1l/vnzYIbKvJLeb/eRfbN3pA70A4%2bxqqfqSubAOz5LYRUv8/olnv77FziLtwrFp4vQ2t%2bG0MR1DIWHMRgewkhkVK3h8REM3BlU36yPRkMYuDtE34w5nGWd5VlG%2bVY0yozJWnQUg/IMVZNnKDvZDNLHJU/JH7lvTLpBuUNhlJwyj77lOaxCkRA4a3MVDJc%2bx7exB1j/YxGpn2ew9MscVp/FqJa257CyE0NyY5p6%2bnkc6RdxLO/MIbU5g%2bXtOarVZwvI7CbondqaJo/l1p4vIPtbkti5zHfUWbFsejdBuxIbj6lIe8HmJ7C6E0Pi6WMsbc9iZWcemd0kzWJ3MC%2b1NaPuXPl1Hotbs0htThO7uD1Lc1iOMew/WGezGJfejWPtRRy535PgLlQbUfBpCfReAfaOBlgDIix%2bVi54r3ei%2bWYvvc3tLtiCkl/d5UHH2Ah1lrX6RWIlpgvNN6%2bhssVBmi3oJkbo9qD99gBqepsox3Tmm1rrifHd6CZdukFi7MEGBMMjqOlhjLJDhKnNSXnfjR5iKO8X6Uah20sM65aAKO93w9zuhHu4Hf47g6TR/qAb/wNJsoen9N4vYQAAAABJRU5ErkJggg==' /%3e%3c/svg%3e)
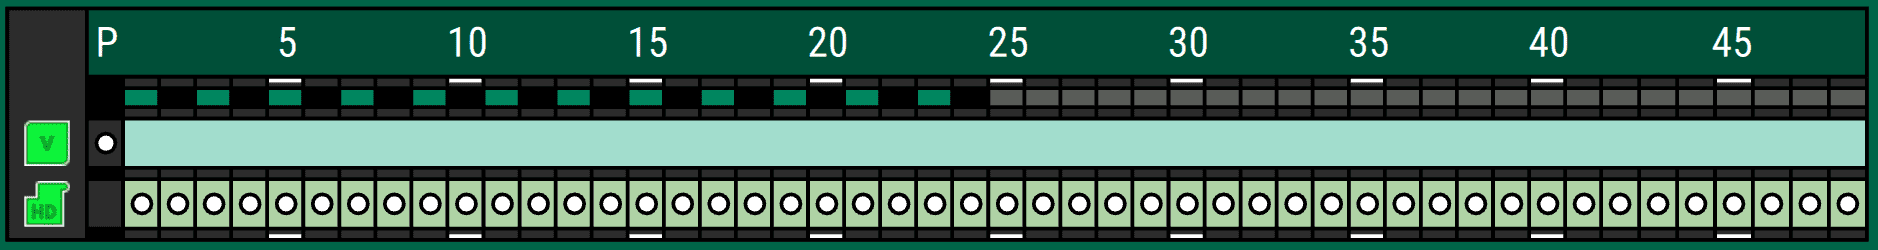
Another outlandish example. Running along the top, just below the row numbers, you can see an alternating pattern of black and green boxes and then a string of grey. Within this particular system, the grower has only made the lefthand rows active (grey are inactive). But at the implement level, the grower has also made all even-numbered rows inactive (black). Combining these rules, the 20|20 knows to only apply product for this system on odd rows on the left side (the green boxes).
When you understand when and how the 20|20 uses these categories to break up your implement, you see how much power it gives you. You can decide exactly how each row should behave.
Group Hardware into Systems
The 20|20 is not tied to any particular implement type or purpose, and often you’ll want to use it to do multiple things, like plant corn and apply fertilizer. To allow for that kind of flexibility, the 20|20 thinks in terms of systems. Systems are types of activity, like seeding or liquid application or row cleaning.
Because you don’t have the same systems as every other grower, the 20|20 needs you to tell it what you do have. Once you do, it can show you the right settings and options, helpfully grouped according to their purpose. But if you forget, the 20|20 will assume you don’t have any systems, and it won’t show you any settings for them. This helps keep things clean and simple, because otherwise you’d have to sift through dozens of settings for systems that you don’t even have.
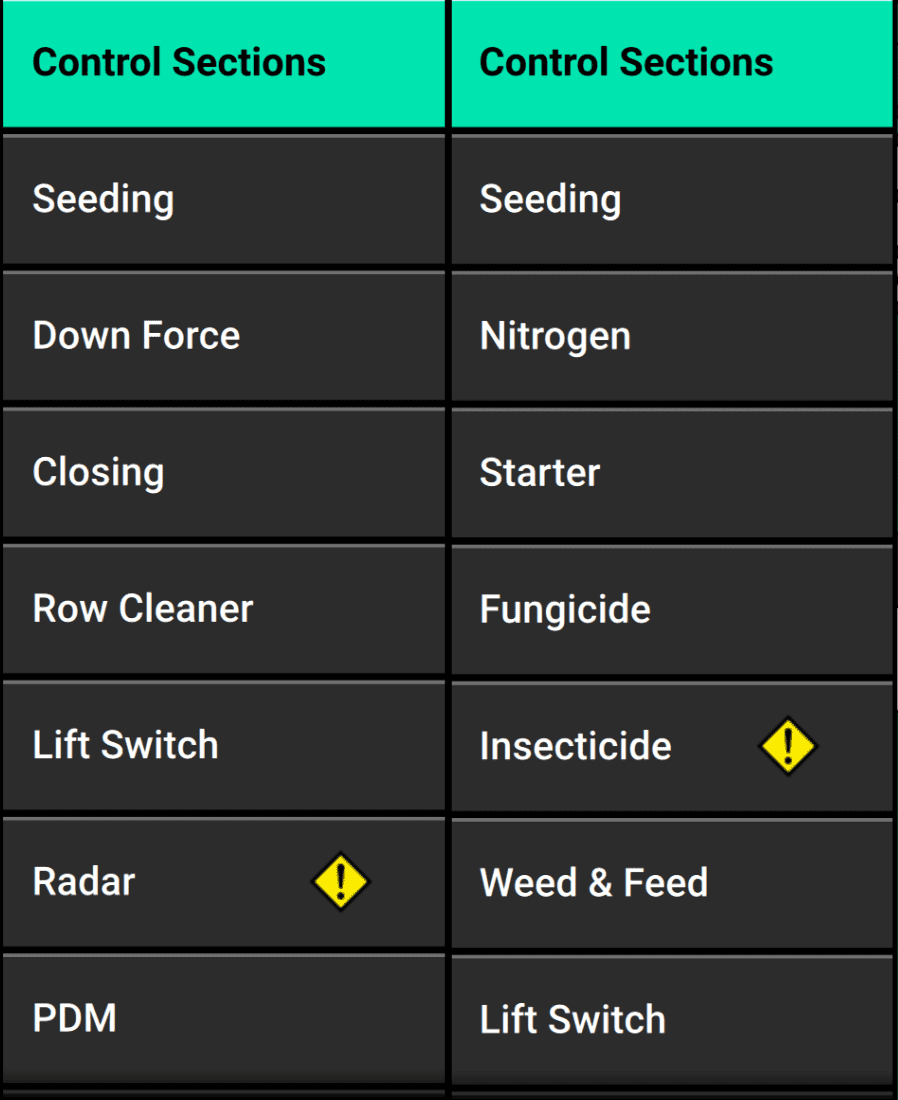
Once you’ve added a system to your 20|20, it’ll appear all over the place: in metrics, in menus for configuration, in diagnostics, and in control pages. Often, the system shows up everywhere with an obvious default name. After all, a seeding system is a seeding system, and you can’t have more than one. But in some cases, like with liquid and granular applications, you can have multiple versions of the same system type. In that case, the 20|20 needs a better name than the generic “liquid,” so it asks you. It offers some preconfigured options, like Nitrogen, Fungicide, and Spray. But really these are just nicknames to help you remember. The 20|20 doesn’t care what you call them, and you can enter your own custom names to suit your needs.
Even for a specific system, the 20|20 still leaves a lot of customization up to you. You might just use it for monitoring, or you might also use it to control application. So the 20|20 needs to know what hardware (”modules”) to associate with each system and where to look for it on the implement.
Think of Application in Terms of Fields
The 20|20 thinks of its activity in terms of fields. Every time it applies any product, it saves all the data it gathers under the currently active field name. And when it moves forward and tries to decide how much more product, if any, to apply next, it looks under the currently active field to see if it’s entering previously covered ground or if there are any prescriptions or boundaries it needs to obey.
That means that if you make a pass across your field and then tell your 20|20 that you’re in a new one, you can go right over the old ground again, and the 20|20 will act like the first pass never happened (but the prior data will still be saved under the old field name).
To use the 20|20 effectively, then, you must always pay attention to what it thinks the “active field” is and remember to tell the system when that changes.
But it’s also helpful to think about what the 20|20 knows about each field and how it uses that information to control the implement. Aside from the record-keeping it does with metrics, the 20|20 knows four things about your field:
- what ground it has already covered
- the prescriptions you’ve added for each system, and how they map different rate targets onto the field
- the internal and external boundaries you’ve assigned to the field, which tell the 20|20 where to stop applying product
- and optionally, whether you want it to simulate headlands so that you can wait to cover that ground after the rest of the field
You can set or reset all of these manually, including by importing data from another implement or just by clearing this 20|20’s memory. Check the articles for specific topics to learn more about the details.
Divide Health Status into Traffic Light Colors
Although the 20|20 keeps track of every little detail, it doesn’t want to overwhelm you with information. Instead, it categorizes them. Each measurement as either working as expected, working below expectations, or failing.
To help you quickly see which one you’re dealing with, the 20|20 uses traffic light colors:
- green is good
- yellow is danger
- red is failure
For hardware, there are other diagnostic colors as well. But red, yellow, and green are so fundamental to all 20|20 components that it is worth singling them out.
Usually, you’ll first notice that a system is not doing well on your home screen, then you’ll drill down deeper by tapping on the yellow or red item. Each time you do, you’ll get a more fine-grained picture. Inside a red system, for example, you’ll see that some rows are green. Then you’ll pick one of the red ones and tap it to learn more. Finally, you’ll be left with all the information available for that row, and you can begin to diagnose the problem.
For hardware, the 20|20 knows on its own what counts as healthy. But metrics are less clear cut. What is good for you and your field may not be good for somewhere else. So, for many metrics, the 20|20 lets you set the thresholds for (yellow) alerts and (red) failures.
Not only that, but you can also set what you want the 20|20 to do when something dips below green: what sounds it should make and what screen it should show you.
Navigate the 20|20’s Organization
When you turn on your 20|20, the first thing you’ll see is the home screen. It has multiple tabs along the top that let you switch between named layouts. Each layout contains various widgets that give you quick access to the 20|20 features that matter most to you. You can configure these layouts — swap widgets out for others, rearrange them, or get rid of them entirely — to suit your needs.
A home screen with three tabs along the top and various widgets that let you see at a glance how your time in the field is going.
Broadly speaking, there are two types of widgets available, corresponding to the two roles your 20|20 can play in your operation: metrics widgets for monitoring and control widgets for commanding.
Explore Metrics
Metrics widgets give you an entry-point for exploring the row-by-row performance of your implement:
- Maps can help you visualize your activity.
- A miniature dashboard can show you how each row is doing independently.
- And more basic metrics widgets give you an overview of specific systems.
The simplest way to use these metrics is just to glance at the page. The more green you see, the better. As we saw above, the 20|20 uses color-coding to show how its systems are doing. That applies to widgets and maps as well. Red widgets demand immediate attention, and yellow widgets are worth keeping an eye on.
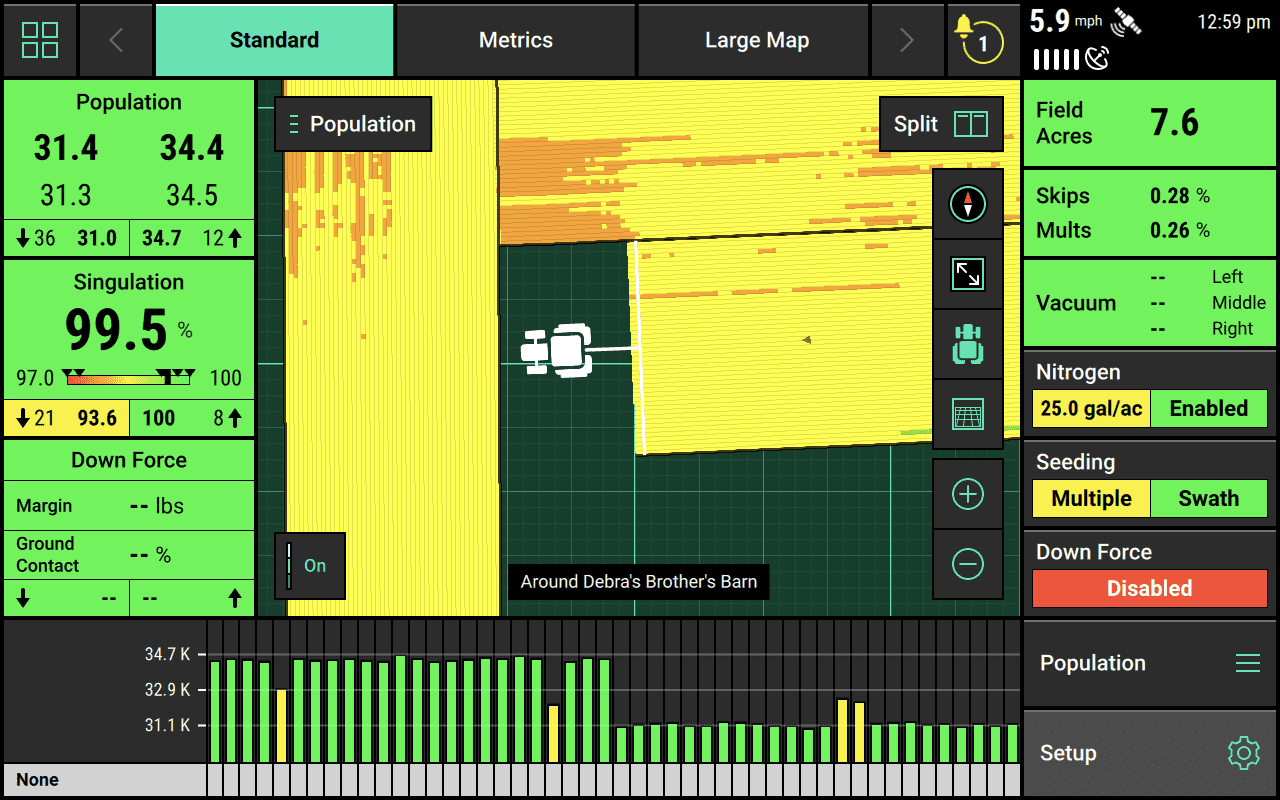
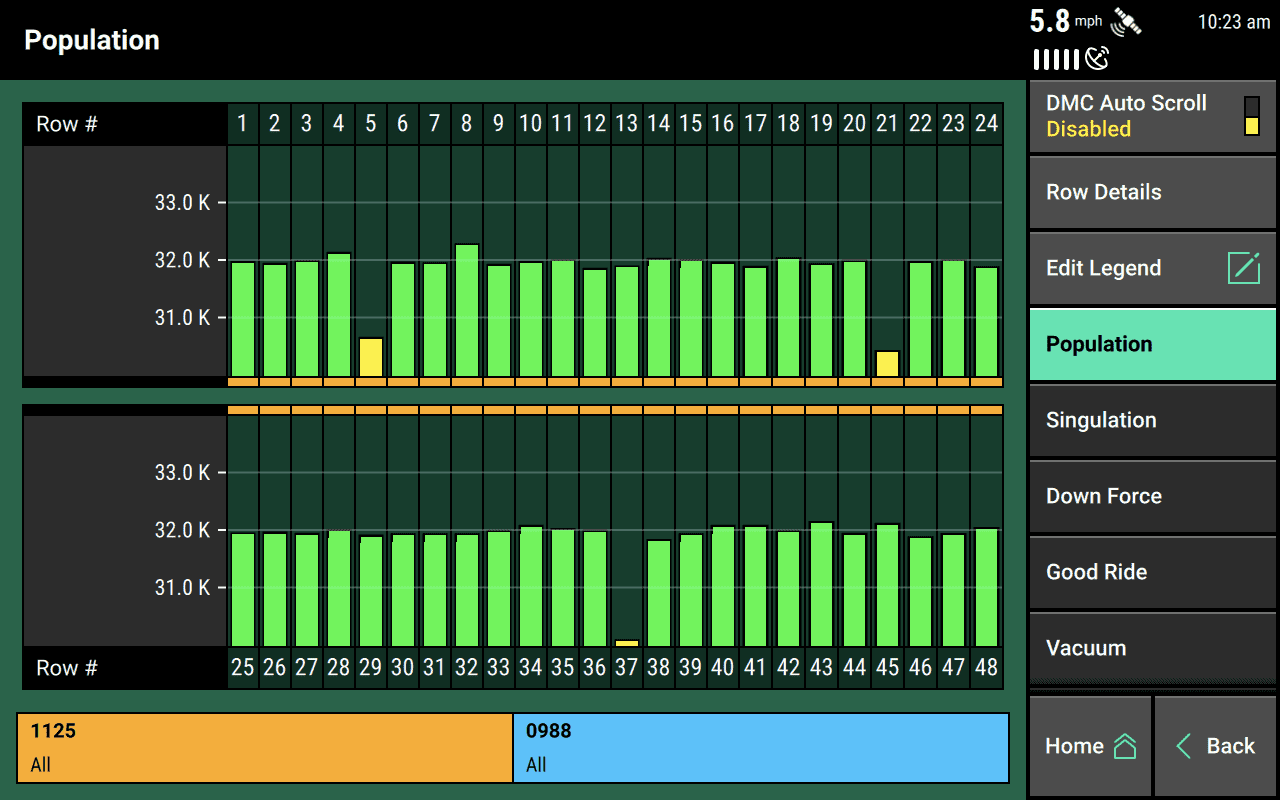
To get a closer look at a system, you can just click on the metric for it. When you do, you’ll be taken to a row-by-row dashboard for that metric: population, down force, or whatever you tapped. If you see any rows that seem to be doing much worse than the others, like in the image below, you can tap one of them.
Tapping on a particular row will zoom in on it, showing you all the major metrics associated with that row. It will also show you a real-time animation of the seeds being planted on that row. This can help you visualize any singulation and spacing problems.
You can also view cumulative metrics in the Field Summary pages.
Control the Implement
If you’re using the 20|20 for control, you will want to have control widgets on your home screen. These take you to control pages that let you adjust your control systems on the fly.
Here’s an example of a control page for seeding, using two rate sections (see above for how rate sections work):
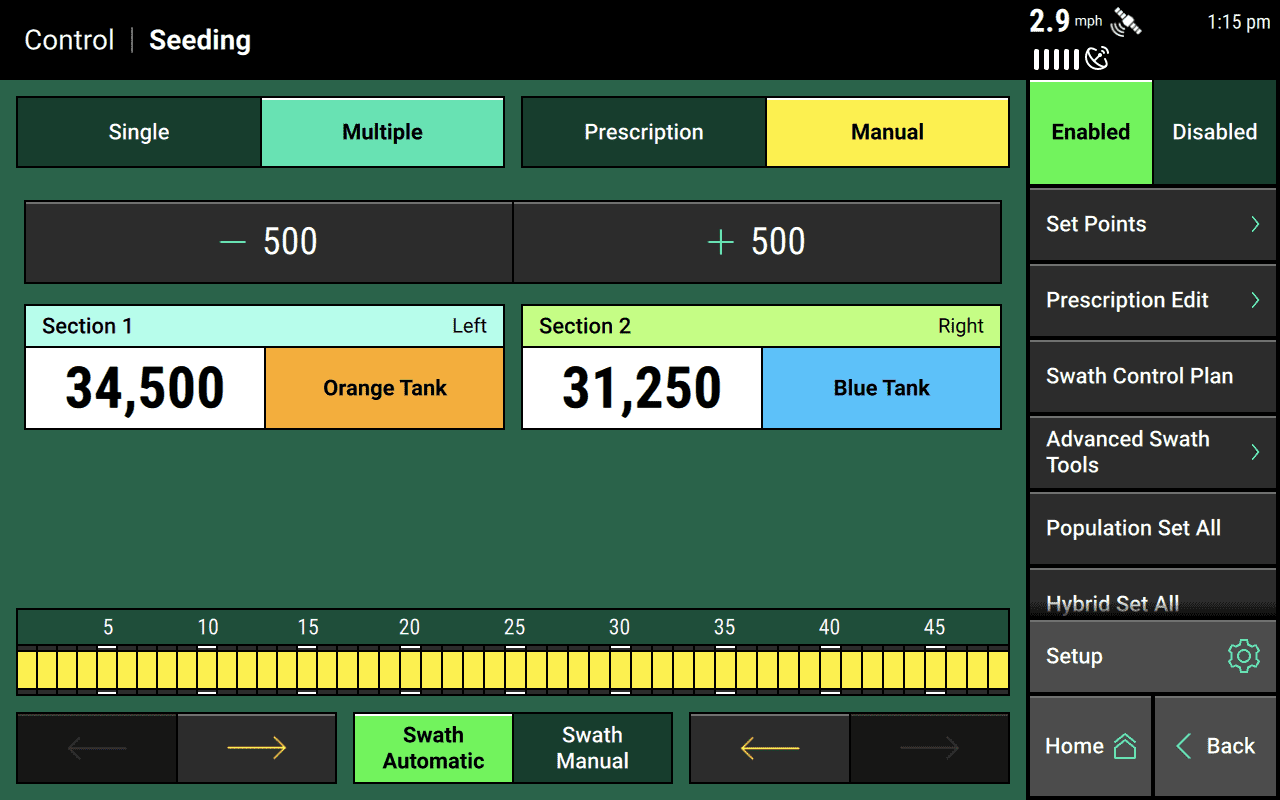
Each control page will look a little different, but the core goals of the page remain fairly consistent:
- set the targets for the system (for example, how many seeds to plant per acre)
- see which rows are currently turned on and which are not
- switch between letting the 20|20 automatically turn rows on and off or doing it yourself manually (swath control)
- switch between using the rate sections configured in systems or ignoring them to apply at a single rate
- switch between manually setting targets or using a prescription to do that for you
For more details on how to use these pages, you can review the articles for each control system type.
Keep an Eye on Notifications
Whenever something goes wrong — a system fails or communication is disrupted — the 20|20 will alert you with a popup. Even after you close the popup, though, you’ll still be able to view the notification in the notification center at the top of your homepage.
The notification center can be a convenient place to look if something seems wrong but you’re not sure what.
Look in the Setup Menu for Everything Else
At the bottom right of your home screen, you’ll see a button labeled Setup. That button takes you to the main menu for nearly all aspects of your 20|20 that aren’t real-time metrics or controls.
We have an article that discusses the whole menu in detail, but here are the most common reasons for going to each submenu:
- to change the active field (Fields)
- to change the active product being applied (Products)
- to configure your implement and add systems to it (Equipment)
- to configure individual systems and their associated hardware (Systems)
- to set alert and failure thresholds (Crops)
- to check the hardware and communication status for each system (Diagnose)
- to import, export, or delete coverage data and the configurations that you set up in the other menus (Data)

Connect 20|20 with External Services
The 20|20 is part of a growing digital ecosystem that lets you expand the 20|20 experience beyond the cab.
Use the 20|20 Connect App
20|20 Connect lets you perform health checks from outside (but near) the cab, by letting your mobile device communicate wirelessly with the 20|20 monitor.
Back Up Your Data with 20|20 Cloud
You can use 20|20 Cloud to streamline data transfer. No need for USB drive hassles anymore. It also provides you the security of knowing that your data is safe if your 20|20 is ever damaged or corrupted.
Import and Export Data
If you don’t have access to a good WiFi connection, you can still use a USB drive to export your data or to save and reuse 20|20 settings or implement configurations. Just go to the Data setup menu and explore your options.
Choose Which Software Version to Use
To get the most from your 20|20, you should keep its software up to date. But there are two releases available to install: a Production Release and a Limited Release. Which one should you choose?
The Limited Release contains the most cutting-edge features. But newer features come with a higher chance of bugs. If you choose to install Limited Release software, you’ll have to update it more frequently.
On the other hand, the Production Release is battle-tested and stable. All its features are at least a year old, so you can be confident that they work. Still, that stability comes with its own price: you may not be able to use the newest hardware, and you won’t have access to all the latest features as they’re rolled out.
For most growers, we recommend you use the Production Release unless you need a feature only available in the Limited Release or unless you're tech savvy and excited to get your hands dirty with new software.