Dashboard Mini Chart
Explore the uses and descriptions for alarms, alerts, metric types, and auto scroll in the Dashboard Mini Chart. The Dashboard Mini Chart shows 20|20 measurements for each row.
Updated June 29, 2020
Alarm and alert values
Rows that exceed alarm values turn yellow.
Rows that exceed alert values turn red.
Set alarm and alert values in the Crops menu.
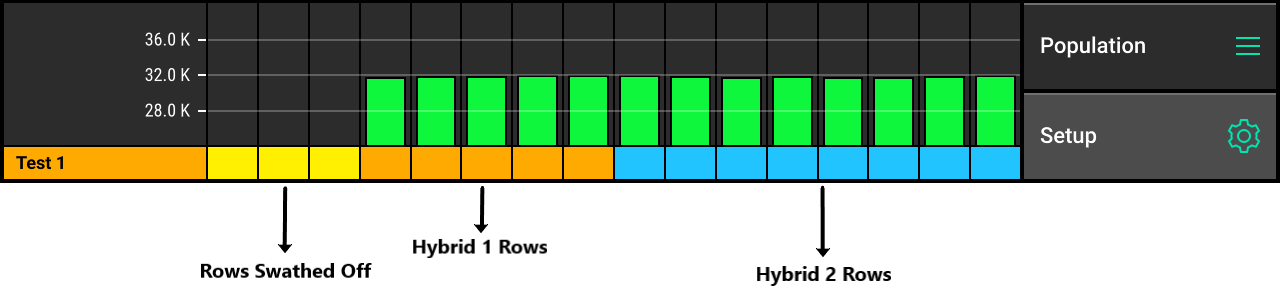
Active hybrids
Find active hybrids below the bar chart. If multiple hybrids are active, the hybrid name and associated color will alternate every five seconds.
Swathed off
Any row marked in yellow instead of a hybrid color means a row is swathed off.
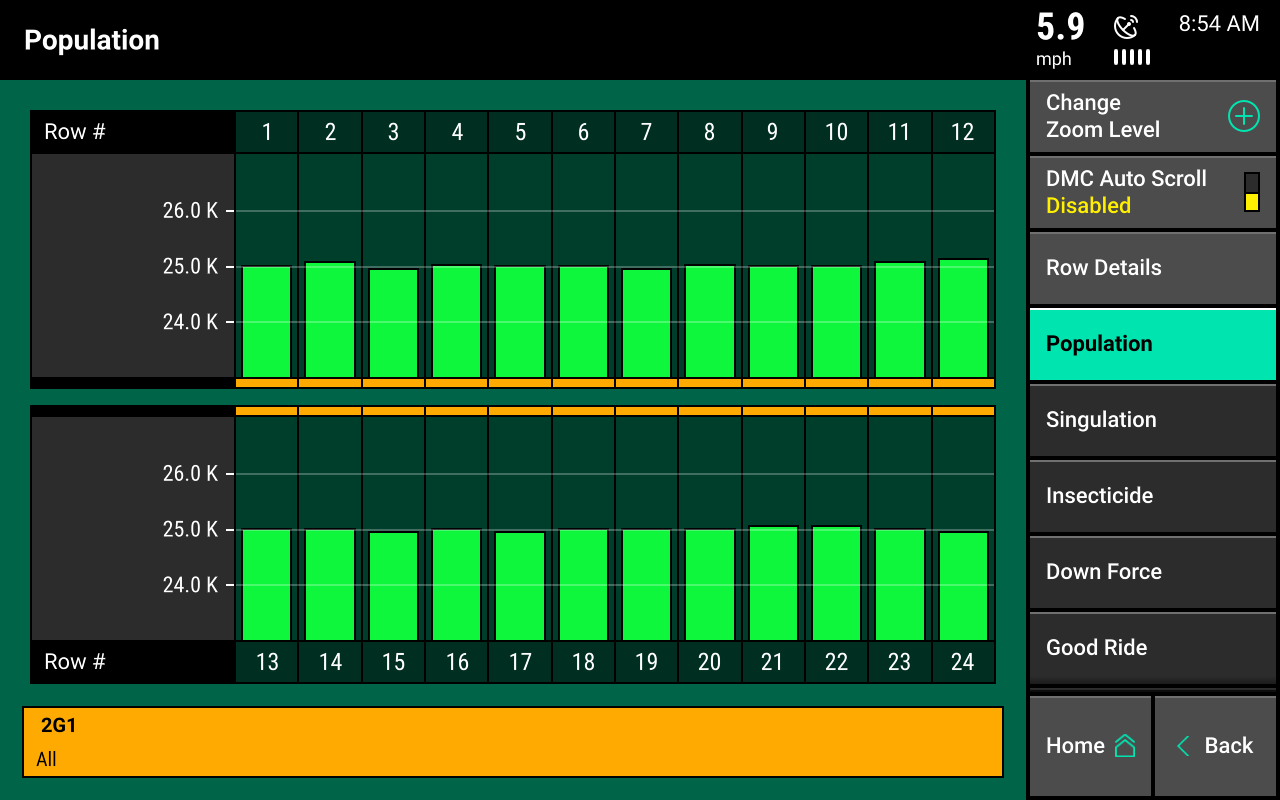
Metric type
Find the metric type displayed above “Setup.” The default metric type is population. Choose a new type at any time.
Change metric type
- Select metric type in Setup.
- A larger row by row chart will appear.
- In the right-hand corner, scroll the navigation pane downward.
- Choose your new metric type.
- Press home to go back to the home screen.
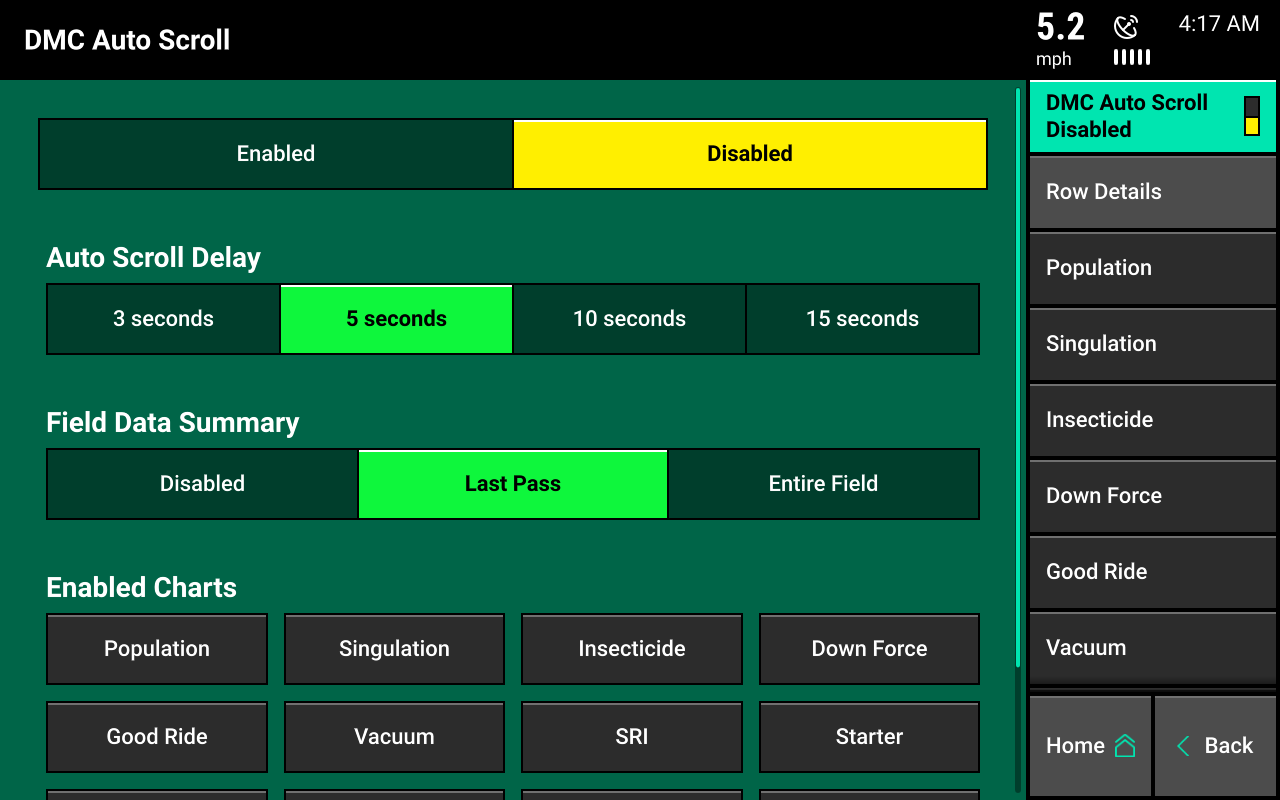
Auto scroll
Set the Dashboard Mini Chart to auto scroll through different metrics.
Set to auto scroll different metrics
- Select DMC Auto Scroll on the selection page.
- Choose how fast you want the Dashboard Mini Chart to scroll through metrics.
- Select the metrics displayed on the home screen.
Field Data Summary can also be enabled.