20|20 Diagnostic Information
Ensure planter diagnostic information is good and find status updates.
Updated July 27, 2020
Diagnose screen
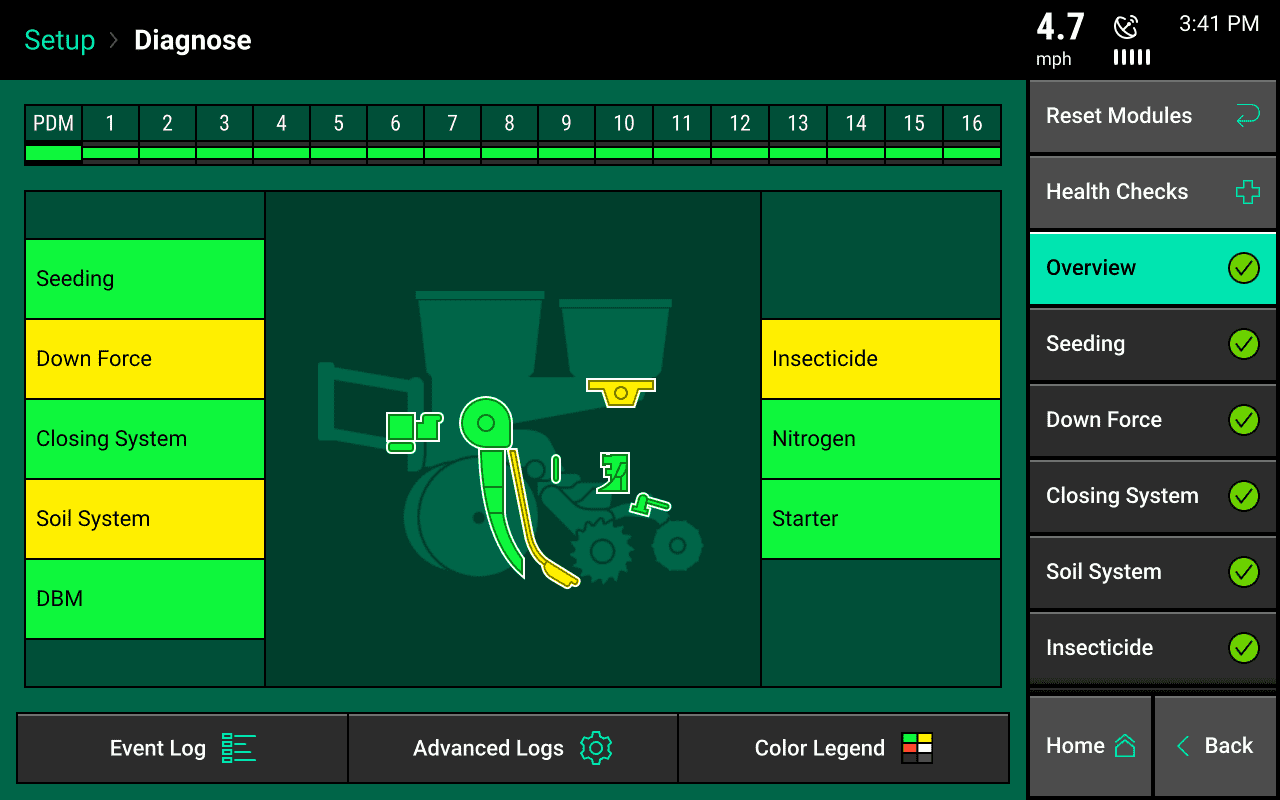
The Diagnose Menu is the primary location for trouble shooting issues related to the operation of the 20|20 system itself and all products configured on the monitor. The schematic on this page shows each component including the Base Module that the display screen connects to. Each product that is configured is displayed along with a row unit showing a drawing of the product(s). Additionally, there is planter bar at the top of the screen displaying the health of each row.
Color legend
| Color | Meaning |
|---|---|
| Green | The system is working correctly and communications are good. |
| Yellow | A device or subcomponent is not running at 100 percent. |
| Red | A device has failed, or is expected, but not detected. |
| White | A device is detected, but is not expected. |
| Black | A row has been disabled in the planter configuration. |
| Gray | A device is being detected, updating firmware, or unreachable. |
All systems should be Green before using the system in the field. The color of each system on the top level diagnose page will be reflected by any issues within the system. For example if there is an issue on one row, that row number will be a color other than green at the top of the page and the system (e.g. vDrive, DeltaForce, etc….) will also be red. Touch on the system name to view the row by row level two details page. Anything on the level two detail pages that is working correctly (indicated by a green color) will be marked by a different color that fits the color legend. If a system is green on the top level page, then everything will also be green on the level two diagnose page for that system. For more information on product specific diagnose page information page, see the operation guide for that specific product.
For assistance with diagnosing issues that are indicated on the diagnose page, see the troubleshooting guides in the Dealer Service Manual.
The Navigation Menu on the right hand side of the screen offers additional options within the Diagnose Menu.
Display Base Module
Displays information about the DBM including the CAN bus usage, Temperatures, voltages, Ethernet ports, and software versions.
Reset Modules
Pressing this button breaks and reestablishes communication between the 20|20 components and is often used as a troubleshooting tool for communication issues.
Health Checks
Perform health checks on the different systems configured on the monitor. Health checks will give a report card for the system after completion. Follow the on screen instructions for each health check. For more information on specific health checks, see the operation guide for each specific product.
Event Log
Select the Event Log button to view a list of all event codes/error codes that have happened on the system. The Event Log is in order from the most recent event to the oldest event with the newest event codes at the top of the list. All events will have a number and a date/time when the event happened along with a description of the event. Select any event code to view additional details for that specific code
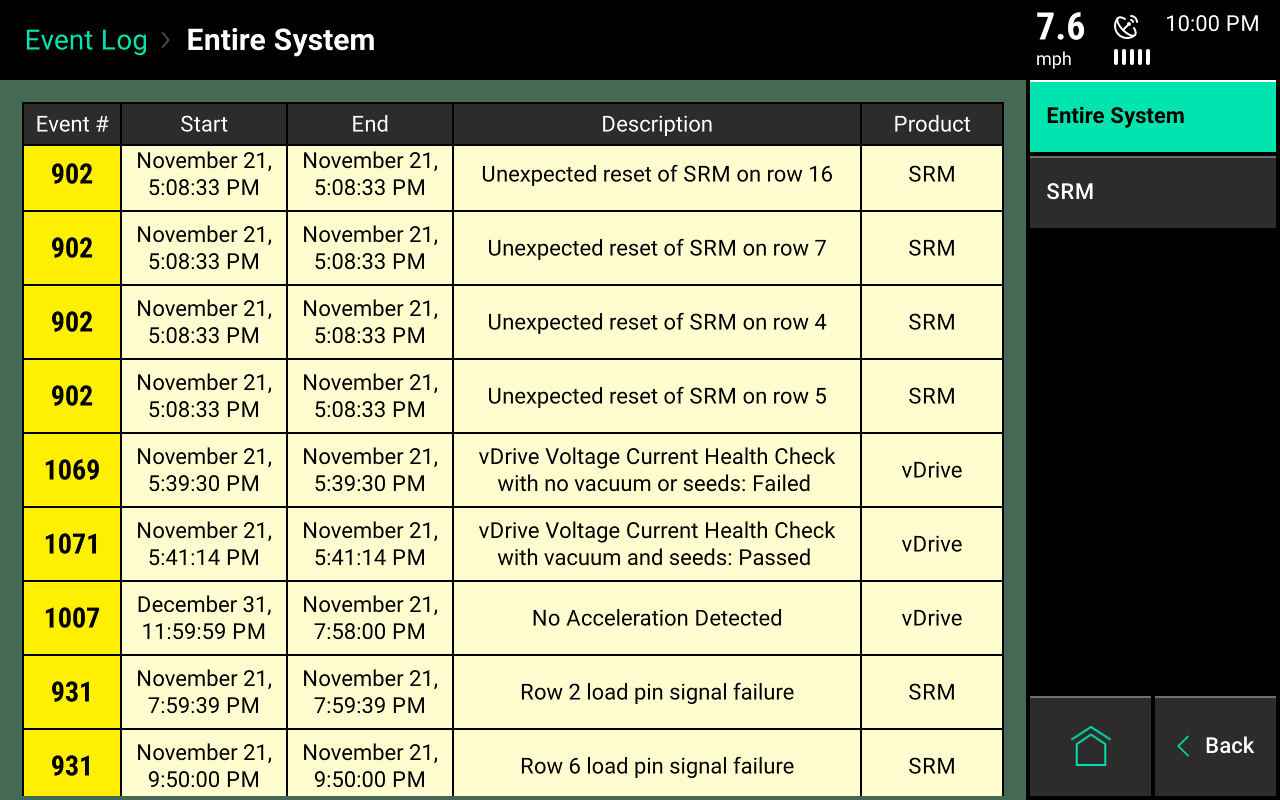
Additionally, event codes can be sorted by a system type. Select the system type on the right hand of the screen (e.g. SRM). System types will only be available for selection if there are event codes for specific systems. Otherwise, select “Entire System” to view all event logs.
Advanced Logs
Allows for a detailed log to be Enabled, Exported, and Deleted. To begin a detailed log, press the “Enable Detailed Log” so that it turns Green. Detailed Logs are taken when requested by the Precision Planting Support Team. A detailed log will run for one minute and then automatically be disabled. Once a log is captured, select the “Export – System Data Log” button to export the log to a USB drive plugged into display. Once exported logs can be deleted by pressing the “Delete – Log File” button. Systems List - The systems list displays information for all products giving feedback. The default setting is to show readings for things such as Load Cells, Seed Data Counts, and Good Ride. This page is a summary of all systems. Press the “Change Button” at the bottom of the page to change the information being displayed. Press the Change button once to display Voltage readings and twice to display Current readings from all systems. This is a quick guide to view information on multiple systems at the same time.